Lesson Plan Mayans/Mexico Unit Part 2:
Math, Science, and Problem-Solving Skills
Standards:
Standard CCSS.Math.Content.HSS.ID.A.1
Standard CCSS.Math.Content.HSS.IC.B.6
Objective/Goals:
1) To represent data with plots on the real number line (dot
plots, histograms, and box plots).
2) To evaluate reports based on data and make inferences.
Activities/Procedures
(Day 1; Period 2 Time allotted 50 minutes):
1) Students have previously learned about Indian civilization; recap “What do you know?” by asking question prior to lesson (5 minutes allotted).
2) Share goals of the day. Discuss the following key questions: “What can you tell me about Mayan cities?” & “Why did things change for the Mayans and their cities?”
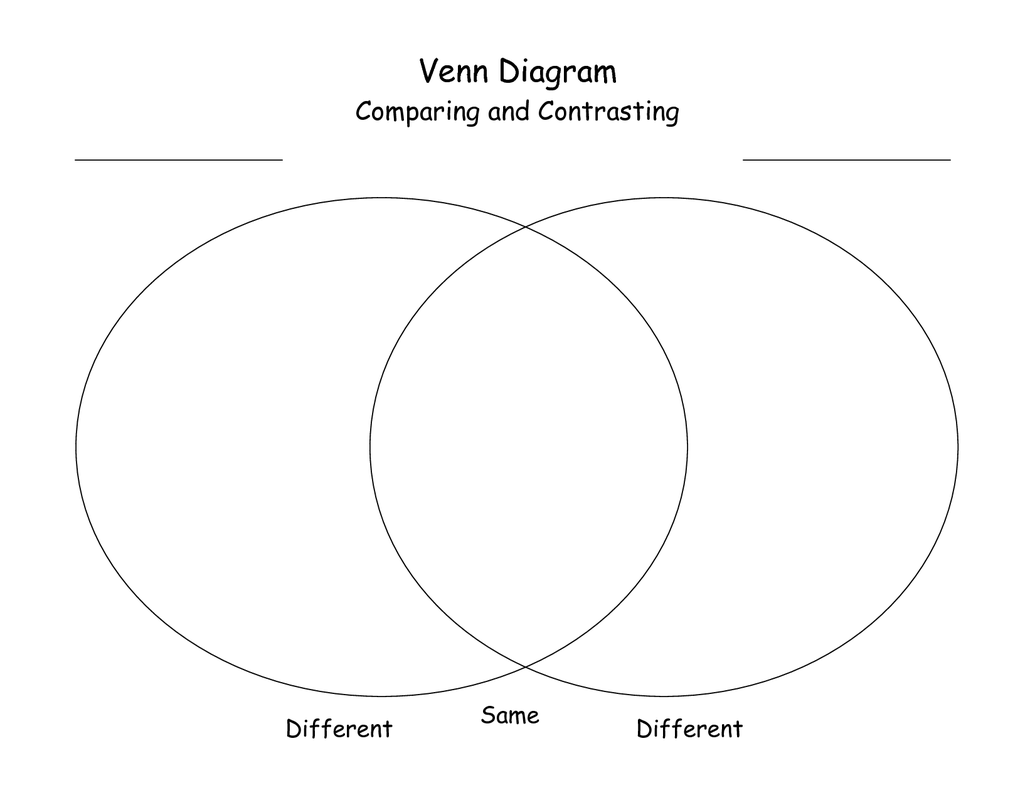
Model the activity of filling out a Venn diagram by using the projector to demonstrate an example (5 minutes allotted).
3) Have the students research websites assigned (e.g. Maya; History.com) and fill out Venn diagram organizer in computer lab (30 minutes allotted).
4) Assign students to complete the diagram.
Activities/Procedures
(Day 1; Period 2; Time allotted—50 minutes):
1) Share goals of the day. Have students
get out their homework assignment. Students will hang their completed chart. (Time allotted 10 minutes).
2) Have the students read each posted chart and fill out an exit card answering the following questions: 1) What did you find surprising when you researched the topic?” 2) “What did you find surprising in classmates’ research?” Walk around the classroom to confer, assist, and observe. (Time allotted 40 minutes).
3) Assign students to create a poster collage.
Day 1; Periods 1 & 2:
Materials/Resources
Pens, pencils, computers, Venn diagram chart for group activity,
poster board, markers, newspapers, and exit cards
Differentiation:
The lesson plans include scaffolding from prior knowledge and newly taught information to help students make connections. The teacher integrates modeling of Venn diagram chart to provide clarity and support. The teacher reviews with background information regarding the lesson so it will be familiar during activities. They will have read/discussed
relevant material prior to the lesson. Poster assignment appeals to the creative and/or visual learners.
Evaluation and Reflection:
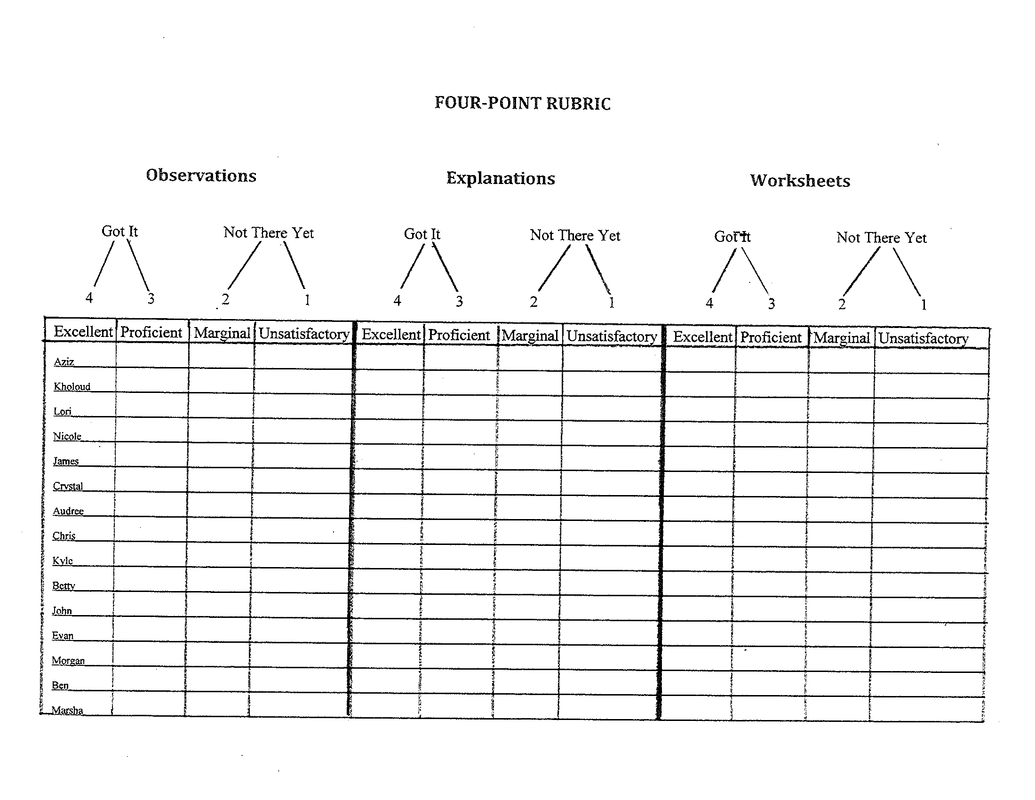
Assessment consists of class observation, Venn diagram chart, exit card responses and poster collage of related ideas. For observation assessment, the four score rubric will be used. Reflection opportunities consist of students reflecting on class discussion questions, Venn diagram graphic organizer task, group collaboration, and poster collage of visual representation of their ideas.
Behavior Management:
It is important to keep students actively engaged while observing and supporting their tasks at hand assists behavior management. Previously providing explicit instruction on class expectation and consequences can decrease behavior issues. Explicit instruction on lessons and tasks at hand also decrease behavior issues and increase overall learning.
Activities/Procedures (Day 2; Period 1 Time allotted—50 minutes):
1) Share general plans of the day. (Time allotted 5 minutes).
2) Ask students to brainstorm with group, and in journals on meaning of diversity prior to discussing its meaning. (Time allotted 5 minutes).
3) Discuss the meaning of diversity with students. Explain: To get along with other people, it’s necessary to be tolerant of the ways they are different from you. Our world is made up of people from many different cultures, races, and backgrounds. We all want to be liked and treated well, and stereotypes and prejudice only foster bad feelings. If we respect each other’s differences, we can all learn from each other. No matter how different people look or act, we must always be kind to them. It takes time to really get to know people—beyond the way they look, talk, or act. And think about it: wouldn’t the world be a place if everyone were the same?" and model how to be accepting, and how not to be. (Time allotted 5 minutes).
4) Model examples of dot plots, histograms, and box plots. Assign students to create one of the three graphs to represent Mayan data. (e. g. population of cities,
timelines of achievements, etc.) Walk around the computer lab to confer, assist, and observe (Time allotted 45 minutes).
3) Assign students to complete for homework if not finished.
Activities/Procedures (Day 2; Period 2 Time allotted—50 minutes):
1) Share general goals of the day. (Time allotted 5 minutes).
2) Ask students to get into groups and compare/share feedback on graphs. (Time allotted 15 minutes).
3) Present group collaboration findings in class. (Time allotted 10 minutes).
4) Assign students brainstorming to create another graph based on modern day history for homework in journals. Walk around the classroom to confer, assist, and observe. (Time allotted 10 minutes).
Day 2; Periods 1 & 2:
Materials/Resources:
Pens, pencil, graph paper, journals for brainstorming, computers
Differentiation:
The lesson plans include scaffolding from prior knowledge and newly taught information to help students make connections. The teacher integrates modeling of graphs to provide clarity and support. The teacher reviews with background information regarding the lesson so it will be familiar during activities. They will have read/discussed relevant material prior to the lesson. The teacher assigns brainstorming to aid in organizing ideas. Group collaboration aids all students, including struggling students that need additional
support.
Evaluation and Reflection:
Assessment consists of class observation, group collaboration observation, and graphs. For observation assessment, the four score rubric will be used. Reflection opportunities consist of students reflecting on class discussion questions,
group collaboration, creating graphs, and journal tasks such as brainstorming ideas and visual representation of ideas.
Behavior Management:
It is important to keep students actively engaged while observing and supporting their tasks at hand assists behavior management. Previously providing explicit instruction on class expectation and consequences can decrease behavior issues. Explicit instruction on lessons and tasks at hand also decrease behavior issues and increase overall learning.
Activities/Procedures (Day 3; Period 1 Time allotted—50 minutes):
1) Share general goals of the day. (Time allotted 5 minutes).
2) Have students share brainstorming ideas with a partner. They will decide on a modern day historical topic to research (and will eventually create graphs pertaining to the topic). Walk around the classroom to confer, assist, and observe (Time allotted 5 minutes).
3) Have students research the topic. (Time allotted 30 minutes).
Activities/Procedures (Day 3; Period 2 Time allotted—50 minutes):
1) Share general goals for the day (5 minutes allotted).
2) Teacher models the creating of the graphs with data input on the computer (5 minutes allotted).
3) Each student will create one graph on same topic. Students will print out their graphs. Walk around the room to confer, assist, and observe. (Time allotted 30
minutes).
4) Students must make a poster with their printouts, including other visuals like pictures or drawings to post in class the following week.
Day 3; Periods 1 & 2:
Materials/Resources:
Pens, pencils, journals, computers, graph-making computer programs, printer, markers, pictures/photographs, and poster scroll paper with adhesive to hang
Differentiation:
The lesson plans include scaffolding from prior knowledge and newly taught information to help students make connections. The teacher integrates modeling of integrating data into a graph on computer to provide clarity and support. The teacher reviews with background information regarding the lesson so it will be familiar during activities. They
will have read/discussed relevant material prior to the lesson. Partner collaboration will provide additional support.
Evaluation and Reflection:
Assessment consists of class observation, completed graph printouts, posters, journal tasks checks, and partner collaboration observation. For observation, the four score rubric will be used for assessment. Reflection opportunities consist of students reflecting on class discussion questions, partner collaboration, and journal tasks such as brainstorming ideas and visual representation of ideas.
Behavior Management:
It is important to keep students actively engaged while observing and supporting their tasks at hand assists behavior management. Previously providing explicit instruction on class expectation and consequences can decrease behavior issues. Explicit instruction on lessons and tasks at hand also decrease behavior issues and increase overall learning.
Math, Science, and Problem-Solving Skills
Standards:
Standard CCSS.Math.Content.HSS.ID.A.1
Standard CCSS.Math.Content.HSS.IC.B.6
Objective/Goals:
1) To represent data with plots on the real number line (dot
plots, histograms, and box plots).
2) To evaluate reports based on data and make inferences.
Activities/Procedures
(Day 1; Period 2 Time allotted 50 minutes):
1) Students have previously learned about Indian civilization; recap “What do you know?” by asking question prior to lesson (5 minutes allotted).
2) Share goals of the day. Discuss the following key questions: “What can you tell me about Mayan cities?” & “Why did things change for the Mayans and their cities?”
Model the activity of filling out a Venn diagram by using the projector to demonstrate an example (5 minutes allotted).
3) Have the students research websites assigned (e.g. Maya; History.com) and fill out Venn diagram organizer in computer lab (30 minutes allotted).
4) Assign students to complete the diagram.
Activities/Procedures
(Day 1; Period 2; Time allotted—50 minutes):
1) Share goals of the day. Have students
get out their homework assignment. Students will hang their completed chart. (Time allotted 10 minutes).
2) Have the students read each posted chart and fill out an exit card answering the following questions: 1) What did you find surprising when you researched the topic?” 2) “What did you find surprising in classmates’ research?” Walk around the classroom to confer, assist, and observe. (Time allotted 40 minutes).
3) Assign students to create a poster collage.
Day 1; Periods 1 & 2:
Materials/Resources
Pens, pencils, computers, Venn diagram chart for group activity,
poster board, markers, newspapers, and exit cards
Differentiation:
The lesson plans include scaffolding from prior knowledge and newly taught information to help students make connections. The teacher integrates modeling of Venn diagram chart to provide clarity and support. The teacher reviews with background information regarding the lesson so it will be familiar during activities. They will have read/discussed
relevant material prior to the lesson. Poster assignment appeals to the creative and/or visual learners.
Evaluation and Reflection:
Assessment consists of class observation, Venn diagram chart, exit card responses and poster collage of related ideas. For observation assessment, the four score rubric will be used. Reflection opportunities consist of students reflecting on class discussion questions, Venn diagram graphic organizer task, group collaboration, and poster collage of visual representation of their ideas.
Behavior Management:
It is important to keep students actively engaged while observing and supporting their tasks at hand assists behavior management. Previously providing explicit instruction on class expectation and consequences can decrease behavior issues. Explicit instruction on lessons and tasks at hand also decrease behavior issues and increase overall learning.
Activities/Procedures (Day 2; Period 1 Time allotted—50 minutes):
1) Share general plans of the day. (Time allotted 5 minutes).
2) Ask students to brainstorm with group, and in journals on meaning of diversity prior to discussing its meaning. (Time allotted 5 minutes).
3) Discuss the meaning of diversity with students. Explain: To get along with other people, it’s necessary to be tolerant of the ways they are different from you. Our world is made up of people from many different cultures, races, and backgrounds. We all want to be liked and treated well, and stereotypes and prejudice only foster bad feelings. If we respect each other’s differences, we can all learn from each other. No matter how different people look or act, we must always be kind to them. It takes time to really get to know people—beyond the way they look, talk, or act. And think about it: wouldn’t the world be a place if everyone were the same?" and model how to be accepting, and how not to be. (Time allotted 5 minutes).
4) Model examples of dot plots, histograms, and box plots. Assign students to create one of the three graphs to represent Mayan data. (e. g. population of cities,
timelines of achievements, etc.) Walk around the computer lab to confer, assist, and observe (Time allotted 45 minutes).
3) Assign students to complete for homework if not finished.
Activities/Procedures (Day 2; Period 2 Time allotted—50 minutes):
1) Share general goals of the day. (Time allotted 5 minutes).
2) Ask students to get into groups and compare/share feedback on graphs. (Time allotted 15 minutes).
3) Present group collaboration findings in class. (Time allotted 10 minutes).
4) Assign students brainstorming to create another graph based on modern day history for homework in journals. Walk around the classroom to confer, assist, and observe. (Time allotted 10 minutes).
Day 2; Periods 1 & 2:
Materials/Resources:
Pens, pencil, graph paper, journals for brainstorming, computers
Differentiation:
The lesson plans include scaffolding from prior knowledge and newly taught information to help students make connections. The teacher integrates modeling of graphs to provide clarity and support. The teacher reviews with background information regarding the lesson so it will be familiar during activities. They will have read/discussed relevant material prior to the lesson. The teacher assigns brainstorming to aid in organizing ideas. Group collaboration aids all students, including struggling students that need additional
support.
Evaluation and Reflection:
Assessment consists of class observation, group collaboration observation, and graphs. For observation assessment, the four score rubric will be used. Reflection opportunities consist of students reflecting on class discussion questions,
group collaboration, creating graphs, and journal tasks such as brainstorming ideas and visual representation of ideas.
Behavior Management:
It is important to keep students actively engaged while observing and supporting their tasks at hand assists behavior management. Previously providing explicit instruction on class expectation and consequences can decrease behavior issues. Explicit instruction on lessons and tasks at hand also decrease behavior issues and increase overall learning.
Activities/Procedures (Day 3; Period 1 Time allotted—50 minutes):
1) Share general goals of the day. (Time allotted 5 minutes).
2) Have students share brainstorming ideas with a partner. They will decide on a modern day historical topic to research (and will eventually create graphs pertaining to the topic). Walk around the classroom to confer, assist, and observe (Time allotted 5 minutes).
3) Have students research the topic. (Time allotted 30 minutes).
Activities/Procedures (Day 3; Period 2 Time allotted—50 minutes):
1) Share general goals for the day (5 minutes allotted).
2) Teacher models the creating of the graphs with data input on the computer (5 minutes allotted).
3) Each student will create one graph on same topic. Students will print out their graphs. Walk around the room to confer, assist, and observe. (Time allotted 30
minutes).
4) Students must make a poster with their printouts, including other visuals like pictures or drawings to post in class the following week.
Day 3; Periods 1 & 2:
Materials/Resources:
Pens, pencils, journals, computers, graph-making computer programs, printer, markers, pictures/photographs, and poster scroll paper with adhesive to hang
Differentiation:
The lesson plans include scaffolding from prior knowledge and newly taught information to help students make connections. The teacher integrates modeling of integrating data into a graph on computer to provide clarity and support. The teacher reviews with background information regarding the lesson so it will be familiar during activities. They
will have read/discussed relevant material prior to the lesson. Partner collaboration will provide additional support.
Evaluation and Reflection:
Assessment consists of class observation, completed graph printouts, posters, journal tasks checks, and partner collaboration observation. For observation, the four score rubric will be used for assessment. Reflection opportunities consist of students reflecting on class discussion questions, partner collaboration, and journal tasks such as brainstorming ideas and visual representation of ideas.
Behavior Management:
It is important to keep students actively engaged while observing and supporting their tasks at hand assists behavior management. Previously providing explicit instruction on class expectation and consequences can decrease behavior issues. Explicit instruction on lessons and tasks at hand also decrease behavior issues and increase overall learning.